Welcome! This is the companion lab guide to this blog post: https://blog.ecapuano.com/p/prefetch-analysis-lab
Set up your analysis VM
-
Download and install a free trial of VMware Workstation or use a hypervisor of your choice.
-
Download and deploy a free Windows 11 VM directly from Microsoft.
- The lab was built specifically using this VM so your mileage may vary if you use a different system.
-
Once the VM is up and running, setup the lab environment by running the following command in an Administrative PowerShell console. Feel free to first inspect the script.
IEX (New-Object Net.Webclient).downloadstring("<https://ec-blog.s3.us-east-1.amazonaws.com/DFIR-Lab/PF_Lab/prep_lab.ps1>")
- This script will automatically install DotNet 6, Eric Zimmerman’s tools as well as download the forensic evidence.
-
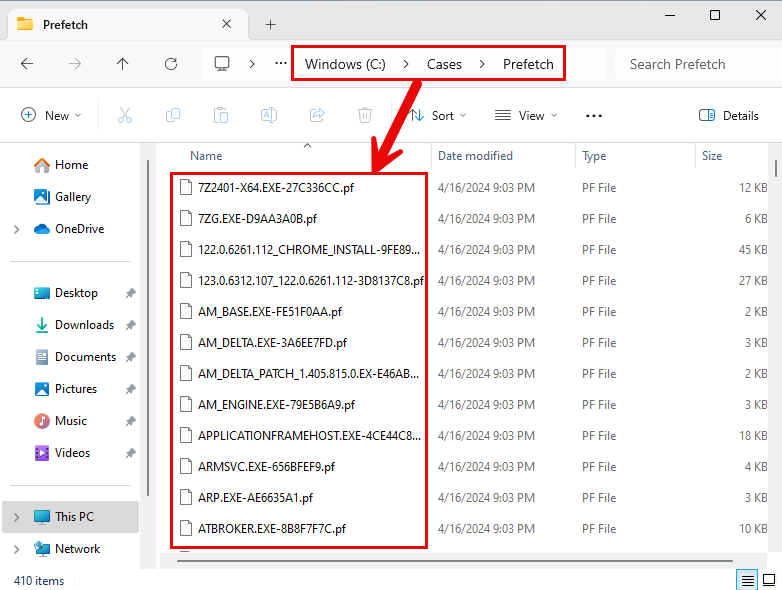
Confirm that the evidence is now located in C:\Cases\Prefetch
Begin Analysis
It is important to note a few things about prefetch analysis. Generally, we can look at the filesystem timestamps of a Prefetch (.pf) file to learn two key datapoints
- Creation (B) time: generally the first time the program was executed
- Modified (M) time: generally the last time the program was executed
However, the prefetch files we are analyzing in this lab do not have their original filesystem timestamps. This is not a critical issue for the lab, however, because you will soon learn that we are able to carve up to 8 of the most recent execution times from within the Prefetch file itself.
By parsing the contents of a prefetch file, we are able to learn about
- Up to 8 of the most recent run times of executables
- Files & Directories accessed within the first ~10 seconds of execution
Create a Prefetch Timeline
The first tool we’ll focus on is PECmd.exe from Eric Zimmerman. This tool is very quick and very thorough at analyzing individual or entire collections of prefetch files. The first analysis step we’ll take is creating a timeline of program executions derived from all available prefetch files acquired from our victim system.
-
From an Administrative PowerShell console, copy and paste the following command:
C:\DFIR_Tools\ZimmermanTools\net6\PECmd.exe -q -d C:\Cases\Prefetch\ --csv "C:\Cases\Analysis\" --csvf prefetch.csv
- We are aiming PECmd at the entire directory of prefetch files acquired from the victim system, specifying an output directory of
C:\Cases\Analysis\ and a CSV filename of prefetch.csv. This command will actually output two files:
prefetch.csv contains a verbose dump of all data extracted from each .pf fileprefetch_Timeline.csv contains a slimmed down timeline of execution derived from all timestamps obtained from within each .pf file
-
Now, we’re ready to open our output files. Launch Timeline Explorer either from the Desktop or from it’s location at C:\DFIR_Tools\ZimmermanTools\net6\TimelineExplorer\TimelineExplorer.exe
-
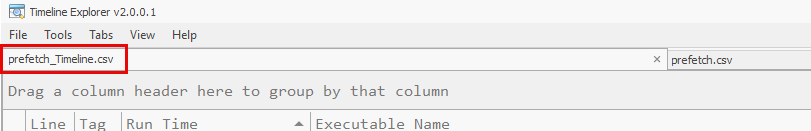
Within Timeline Explorer (subsequently referred to as TLEX), open the following two files we created in the previous step.
- File > Open
C:\Cases\Analysis\prefetch.csvC:\Cases\Analysis\prefetch_Timeline.csv
-
Now that both CSVs are loaded in TLEX, we’ll first start with the prefetch timeline. Select this tab.
-
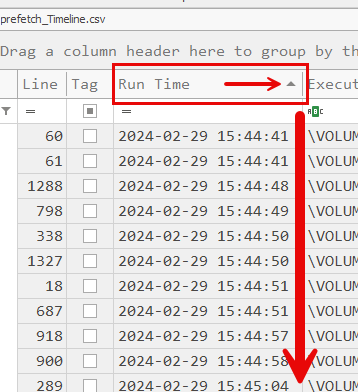
This timeline reveals a chronologically ordered list of program executions on this system based on the parsed timestamps found within the prefetch files.
-
To ensure that executions are being shown in chronological order, be sure that the “Run Time” column is sorted “Ascending” as seen below
-
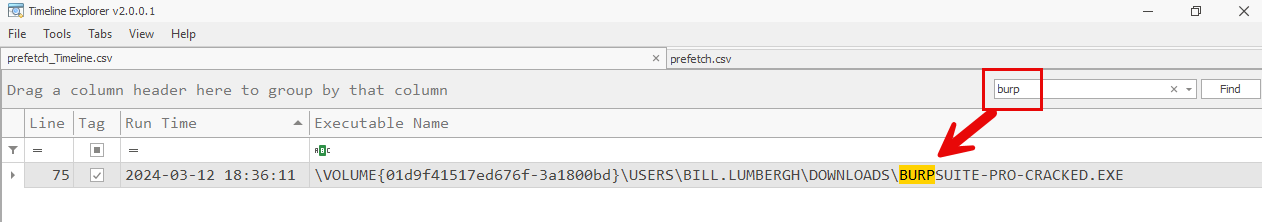
Let’s start by searching for the one datapoint that we have so far. Bill claims to have downloaded and executed a suspicious program called “Burpsuite”. Search for the keyword burp in the global search bar.
-
This reveals a single execution for a program located at \USERS\BILL.LUMBERGH\DOWNLOADS\BURPSUITE-PRO-CRACKED.EXE
-
Take note of the execution time of 2024-03-12 18:36:11 which provides us an important datapoint of when the first suspicious program ran.
-
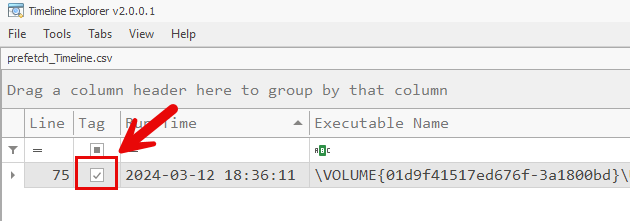
A good habit to develop is “tagging” interesting or relevant entries in your timeline to help return to these items later. Do this by checking the “Tag” box on this column
-
Select this entire row, then clear your keyword search by clicking the “x” in the search box. This enables us to pivot on this entry to see all nearby executions.
-
Now that we can see all nearby executions, let’s briefly examine what happened right BEFORE burpsuite-pro-cracked.exe was executed.
- The execution just prior to our potential malware is a program called
7ZG.EXE which appears to be related to the 7-Zip compression tool. This is a benign, but less common tool on workstations. Based on temporal proximity to our malware execution, we’d likely consider this to be potentially related to the malware execution. We’ll confirm this theory later, but for now, TAG the entry for 7ZG.EXE.
-
Now let’s examine all executions that occurred up to one hour AFTER burpsuite-pro-cracked.exe was executed.
<aside>
➡️ Look for executables with strange filenames or running from unusual locations. Your effectiveness at this depends heavily on familiarity with Windows systems and common executables. Some common things to look for when examining evidence of execution:
- single/double letter executables
- executables in strange locations like
\temp\ directories
- downloaded executables in user
\Downloads\ directories
- unknown executables
- commonly abused LOLBINs (see LOLBAS)
</aside>